Review monitor results
- Review the results of monitors for a closer look at their details.
- Find details on quality issues.
- Adjust tolerance levels or suppress rules that are outdated, irrelevant, or no longer necessary.
- View and copy the SQL queries of custom rules.
- Manage notifications for custom rules.
Prerequisites
- Managing adaptive rule monitors: You have one of the following:
- A global role with the Product Rights > Data Quality global permission.
- The Data Quality Editor or Data Quality Manager resource role with the Data Quality Job > Train Monitors resource permission.
- Managing custom rule monitors: You have the Product Rights > Data Quality global permission, or you have the specific resource permissions for your goal:
- To pass or fail results: You have the Data Quality Job > Train Monitors permission.
- To edit, suppress, or activate a monitor: You have the Edit Monitor permission.
- To delete a monitor: You have the Delete Monitor permission.
- To preview rule breaks: You have the Preview Rule Break Records permission.
Manage adaptive rule monitors
The Details tab allows you to examine the historical performance of specific data quality monitors and make adjustments to ensure they accurately reflect your data quality needs.
Open the adaptive rule actions drawer
- Open the Job Details page of a Data Quality Job.
- Click Monitors.
- In the monitor details table, go to the adaptive rule monitor whose actions drawer you want to open.
- On the right side of the monitor row, click
 , then click Open. The actions drawer appears.
Examine monitor history
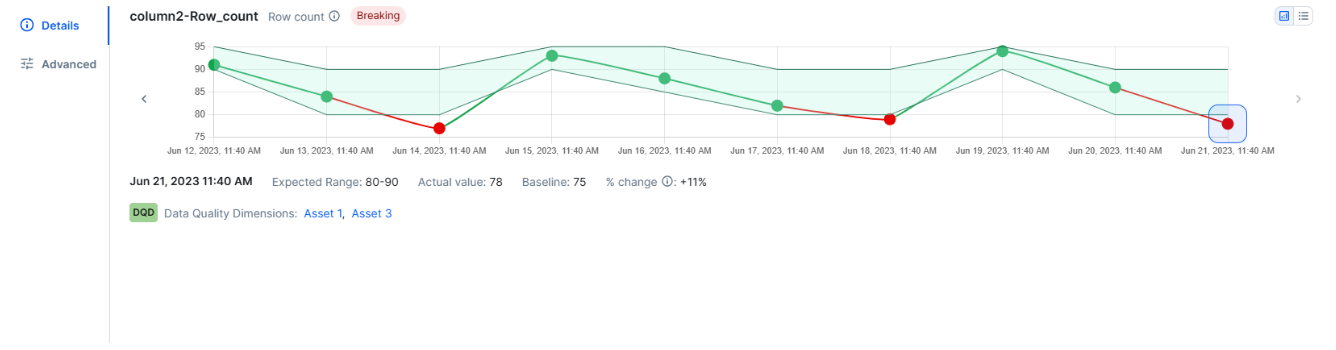
The Details tab contains a line chart showing how the values of the adaptive rule monitor changed across job runs.
In the screenshot, the shaded green area represents the expected range for the monitor. Values within this range show as green points. Points outside the expected range show in red, indicating a potential data quality issue. When you hover your pointer over a point on the line chart, the actual value of that run and its run date are shown.
- In the upper-right corner of the rule actions drawer, click
 to view breaks and metadata from past runs as a chart or
  to view them as a list.
 - When there are more runs than can fit on the screen, you can click
 or
or  to scroll through the run history.
Select a point on the chart to show the detailed run-level metadata for that specific job run beneath the chart. The following metadata is shown:
- Run date and time: The run date (MMM DD, YYYY) and time stamp (HH:MM AM/PM, local browser time) of the job execution.
- Expected range: The range or value the monitor was expected to fall within.
- Actual value: The value found during the selected run. If this value is outside the expected range, it shows in red.
- Baseline: The established baseline value of the monitor. For a comprehensive overview on the calculations of baselines, go to About baseline calculations.
- Percentage change: The percent change between the actual value and the baseline value. This value is shown in red if the actual value is outside the expected range.
Any associated Data Quality Dimensions are also shown, but are not editable.
Configure tolerance levels
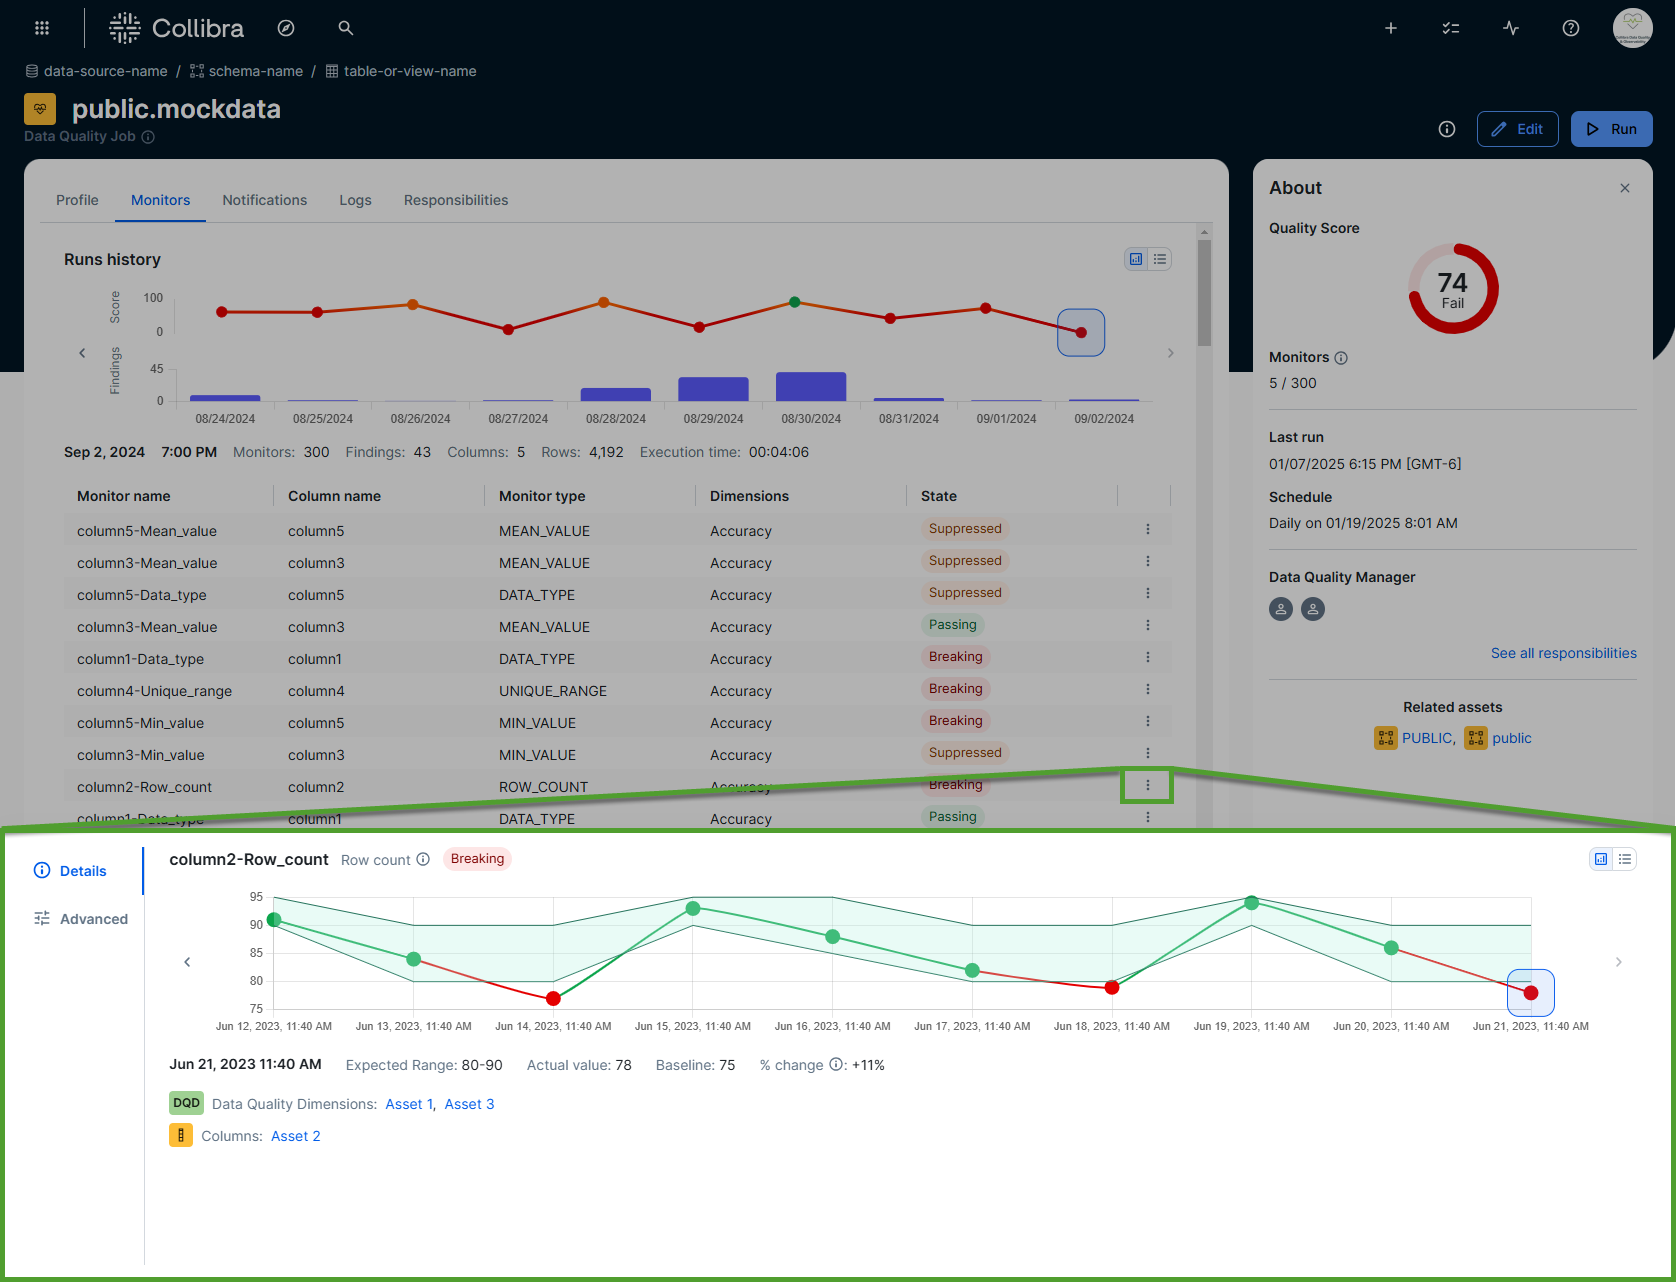
Tolerance levels on the Advanced tab allow you to control how rigidly the adaptive levels of monitors are enforced. By default, the adaptive level for all monitors is set to neutral, but you can choose to enforce them more strictly or leniently.
In the screenshot, the details of the column "column2-Row_count" are expanded to show its row count evolution over a period of time. With this information, you may decide to leave this adaptive rule in its current state, or click Advanced and change the tolerance level to instruct the behavioral model to enforce it differently.
The following steps show you how to configure the tolerance levels of adaptive rules.
- Click
 Advanced. The tolerance options are shown in the Advanced tab.
- Select a tolerance option.
| Tolerance | Description |
|---|---|
| Strict |
Rigidly enforce and flag any data points that fall outside what the behavioral model learns to be normal. Any values outside the strict boundaries will be flagged as potential data quality issues. |
| Neutral | Automatically enforce and flag any data points that fall outside what the behavioral model learns to be normal. Any values outside the neutral boundaries will be flagged as potential data quality issues. |
| Lenient |
Relax the enforcement and flagging when data points fall outside of the range that the behavioral model learns to be normal. Any values outside the lenient boundaries will be flagged as potential data quality issues. Tip This can help avoid excessive alerts when Data Quality & Observability is in the learning phase of a new Data Quality Job. |
Manage custom rule monitors
Whether passing or breaking, you can open the rule actions drawer to:
You can open the rule actions drawer to:
- View a summary of your rule output to allow you to begin scoping remediation efforts for your data quality issue.
- Suppress or activate a rule monitor to exclude or include its findings from the Data Quality Job results.
- View and copy the query of your rule to access the SQL and retrieve the results from the rule run in your data source.
- Manage the recipients of notifications associated with your rule to ensure the appropriate stakeholders are informed about breaking records.
- Preview a limited sample of break records for your rule to effectively plan remediation efforts.
Prerequisites
You have a global role with the Product Rights > Data Quality global permission or the following permissions based on the actions you want to perform:
- To pass or fail the results of a monitor, you have the Data Quality Editor or Data Quality Manager resource role with the Data Quality Job > Train Monitors resource permission.
- To edit, suppress, or activate a monitor, you have the Data Quality Editor or Data Quality Manager resource role with the Edit Monitor resource permission.
- To delete a rule monitor, you have the Data Quality Editor or Data Quality Manager resource role with the Delete Monitor resource permission.
- To preview rule breaks, you have the Preview Rule Break Records resource permission.
Open the rule actions drawer
- Open the Job Details page of a Data Quality Job.
- Click Monitors.
- In the monitor details table, go to the rule monitor you want to manage.
- On the right side of the monitor row, click , then click Open. The rule actions drawer appears.
Tip Some options include additional actions, such as activating or suppressing the rule and copying the SQL. Refer to the tabs below for more information.
Understanding the rule overview
The rule overview shows details of the rule monitor, including:
- The run date.
- Whether the rule is passing or failing.
- The number and percentage of breaking records.
- The rule tolerance percentage, when applicable.
- The number and percentage of passing records.
- The number of total records.
- Open the adaptive rules actions drawer.
- Open the Job Details page of a Data Quality Job.
- Click Monitors.
- In the monitor details table, go to the rule monitor you want to manage.
- On the right side of the monitor row, click , then click Open. The rule actions drawer appears.
- When you open the rule actions drawer, the Overview tab opens by default.
- Click a run to view the rule break details.
- In the upper-right corner of the rule actions drawer, click to view breaks and metadata from past runs as a chart or to view them as a list.
- When there are more runs than can fit on the screen, you can click or to scroll through the run history.
- When the SQL exception details setting is enabled, if a SQL exception is detected when the rule runs, click View exception details to see the full error message on the Query tab.
Suppress or activate a rule
You can suppress a rule monitor when it is passing or breaking to exclude its findings from the Data Quality Job results. You can also activate a suppressed rule monitor to include its findings in the results when the job runs again.
To do this, click the switch in the upper-right corner to activate or suppress the rule monitor.
A message confirms whether the monitor is activated or suppressed.
View or copy the SQL query
You can view and copy the query of your rule to access the SQL from the most recent job run so you can retrieve the results from the rule run in your data source.
- Open the adaptive rules actions drawer.
- Open the Job Details page of a Data Quality Job.
- Click Monitors.
- In the monitor details table, go to the rule monitor you want to manage.
- On the right side of the monitor row, click , then click Open. The rule actions drawer appears.
- Click
 Query. The SQL query of the rule monitor is shown in the Query tab.
- Optionally, click
 in the upper-right corner of the drawer to copy the SQL query to your clipboard.
Note When the SQL exception details setting is enabled, if a SQL exception is detected when the rule runs, the full error message is shown beneath the SQL query.
Manage notifications for a rule
Manage notifications so users or user groups receive updates on the rule's status. Notifications are sent when the rule:
- Passes: The rule met the defined thresholds.
- Breaks: The rule exceeded the defined thresholds.
- Fails: The rule failed to run and threw an exception.
After you add a notification for custom rule monitors, the notification applies only to future runs.
- Open the adaptive rules actions drawer.
- Open the Job Details page of a Data Quality Job.
- Click Monitors.
- In the monitor details table, go to the rule monitor you want to manage.
- On the right side of the monitor row, click , then click Open. The rule actions drawer appears.
- Click
 Notifications. The notifications for the rule are shown in the Notifications tab.
- Click Status and select an option from the drop-down list.
The rule is added to your job. - Optionally, enter a unique custom message in the Message input field to include with the notification.
- Click the Recipients drop-down list and select a user or user group to add them to the list of recipients, or click
 to the right of a recipient's username to remove them.
 - The drop-down list of users includes all active users in Collibra.
- By default, the creator of the rule is included as a notification recipient.
- Click
 Add notification.
The notification is added to the Notifications table.
- To remove a notification, click
 to the right of the notification you want to remove.
 - To update a notification, double-click the status, message, or recipients cell of the notification you want to update, then make your desired updates. When you're done, click anywhere outside of the cell you updated to finalize your updates.
Preview a sample of break records
The Break records tab shows a sample of up to 500 rule break records from the most recent job run. This helps you:
- Analyze samples: Review specific records that violated the rule to plan remediation.
- Get all records: To retrieve the complete list, copy the query from the SQL option in the actions drawer and run it on your data source.
To preview a sample of breaking records present in the data source at the time you open the Break records tab, the session manager uses the rule query and, if applicable, the filter query to retrieve data from the data source. If no breaking records are found, the Break records tab does not show any data.
Important To preview break records, you need the Preview Rule Break Records resource permission. If you do not have this permission, this option is unavailable.
- Open the adaptive rules actions drawer.
- Open the Job Details page of a Data Quality Job.
- Click Monitors.
- In the monitor details table, go to the rule monitor you want to manage.
- On the right side of the monitor row, click , then click Open. The rule actions drawer appears.
- Click Break records. A limited sample of the break records for the rule monitor is shown in the Break records tab.
- In the upper-right corner, you can click
 to copy the contents of the break records table to your clipboard, or click
  to download a CSV file of the break records table.
 - Click the header of any column to sort it in ascending or descending order. To filter a column, hover your pointer over it and click
 . You can filter by alphanumerical values or by date when the column contains dates.
 - For a complete list of break records, copy the SQL from the SQL option and run it on your data source.
- You can set a maximum number of records of up to 500 by configuring the break records preview limit on the global rules settings page.
Note The number of break records in the sample can vary between runs. Additionally, because the break records are based on a live query to the data source, changes in the underlying data source can cause the records shown on the Break records tab to differ from the initial results at the time of job run.
Suppress or activate a rule
You can suppress a rule monitor when it is passing or breaking to exclude its findings from the Data Quality Job results. You can also activate a suppressed rule monitor to include its findings in the results when the job runs again.
To do this, click the switch in the upper-right corner to activate or suppress the rule monitor.
A message confirms whether the monitor is activated or suppressed.