> For the complete documentation index, see [llms.txt](https://docs.collibra.com/llms.txt). Markdown versions of documentation pages are available by appending `.md` to page URLs; this page is available as [Markdown](https://docs.collibra.com/data-quality-self-hosted/core-concepts/reports/report-dashboards/dataset-dimension-report.md).

# Dataset Dimension Report

## What is the Dataset Dimension Report?

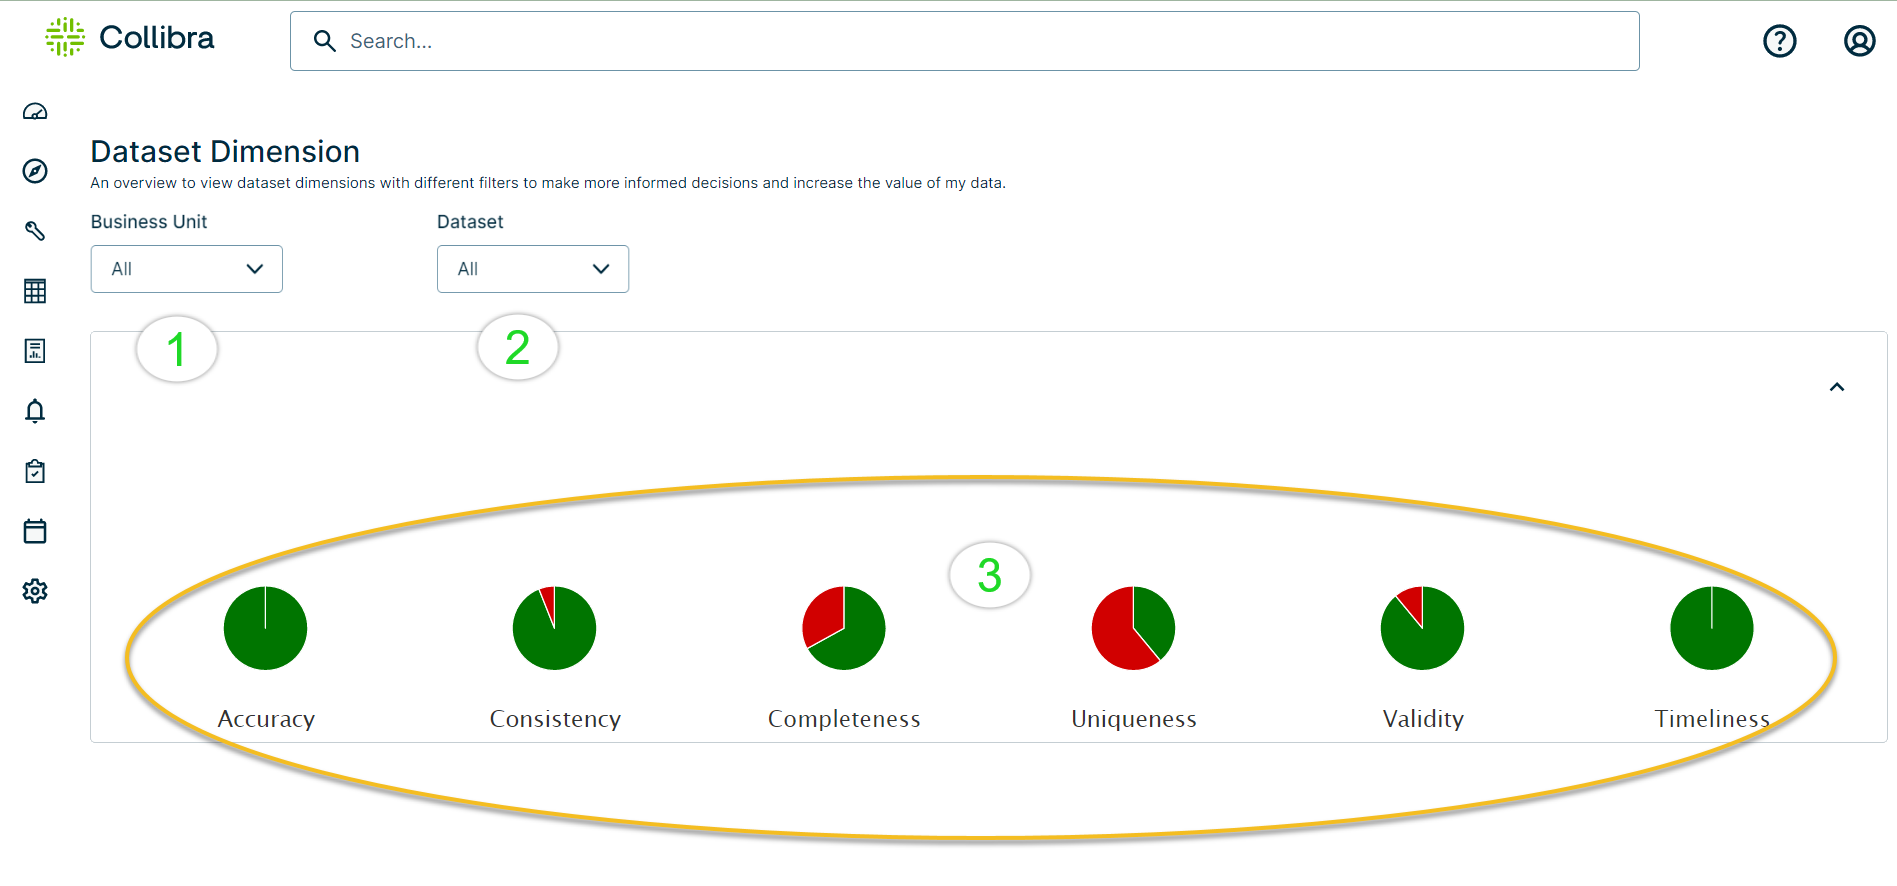
The Dataset Dimension Report provides a way to view and filter Collibra DQ dimension scores by datasets and business units. This report is essentially an overview, which provides insights about averaged or aggregated scores across datasets and business units in the Collibra DQ application.

## Filter by Dataset and Business Unit

The following table describes the Dataset and Business Unit filters.

{% hint style="info" %}
To show/hide any of the charts and tables, click <img src="https://4121921244-files.gitbook.io/~/files/v0/b/gitbook-x-prod.appspot.com/o/spaces%2FWCrP7Albs8DfJjIQxUxw%2Fuploads%2Fgit-blob-e313b3b9a0d71eb97cc8e5fdacfc2b94d749322e%2Fdq-show-arrow-icon.png?alt=media" alt="" data-size="line"> or <img src="https://4121921244-files.gitbook.io/~/files/v0/b/gitbook-x-prod.appspot.com/o/spaces%2FWCrP7Albs8DfJjIQxUxw%2Fuploads%2Fgit-blob-8ea5f15b8759547a2f75120a5c11bf3fd99f243b%2Fdq-hide-arrow-icon.png?alt=media" alt="" data-size="line">.
{% endhint %}

<table data-header-hidden><thead><tr><th></th><th></th><th></th></tr></thead><tbody><tr><td colspan="3"><img src="https://4121921244-files.gitbook.io/~/files/v0/b/gitbook-x-prod.appspot.com/o/spaces%2FWCrP7Albs8DfJjIQxUxw%2Fuploads%2Fgit-blob-ce9fb686cfe3959d1c0c599b9a07b2b661089766%2Fdq-dataset-dimension-report-pie-charts.png?alt=media" alt=""></td></tr><tr><td>1</td><td>Dimension results by business unit.</td><td>Select a business unit from the <strong>Business Unit</strong> dropdown.</td></tr><tr><td>2</td><td>Dimension results by dataset.</td><td>Select the dataset from the <strong>Dataset</strong> dropdown.</td></tr><tr><td>3</td><td>Dimension results pie charts.</td><td><p>Charts that display dimensions based on the criteria you select from the dropdown lists. These charts measure the accuracy, consistency, completeness, uniqueness, validity, and timeliness of your data.</p><div data-gb-custom-block data-tag="hint" data-style="success" class="hint hint-success"><p>You can hover over a chart to view the percentages for that specific dimension.</p></div></td></tr></tbody></table>

## Filter by Time Frames

You can view and filter the table at the bottom of the page by intervals, to display detailed information and metadata. You filter by intervals, such as the current day, or the last 3, 6, or 12 months, by selecting them from the **Intervals** dropdown.

{% hint style="success" %}
You can also narrow your results in the table by entering criteria in the Search... field.
{% endhint %}

![](https://4121921244-files.gitbook.io/~/files/v0/b/gitbook-x-prod.appspot.com/o/spaces%2FWCrP7Albs8DfJjIQxUxw%2Fuploads%2Fgit-blob-170de6ef625f0b8e8aefecb2e82eba5d6b236943%2Fdq-dataset-dimension-report-by-intervals-table.png?alt=media)